Low-GI diets help most in metabolic disease

Low-GI diets help most in metabolic disease

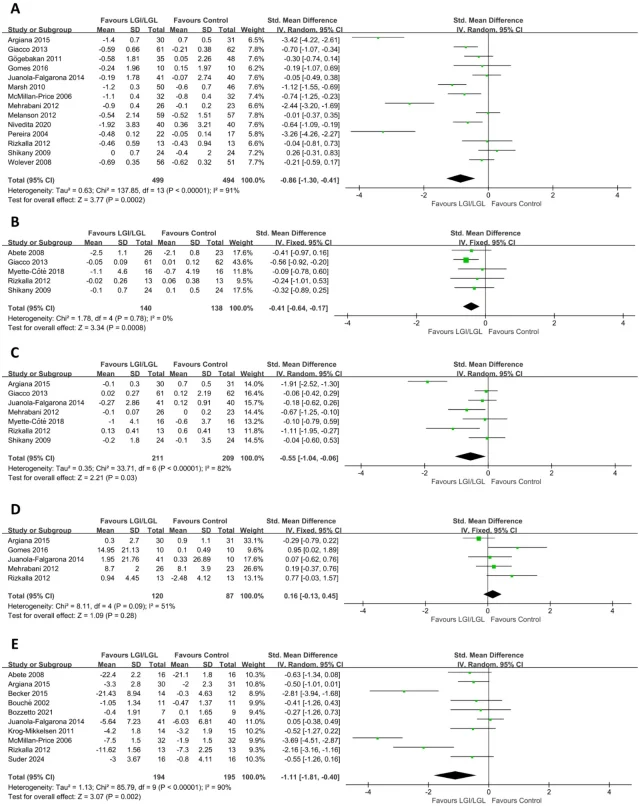
A June 2026 meta-analysis in Frontiers in Nutrition pooled 21 RCTs (n=1,265) on low-glycemic-index/load diets and found large pooled SMDs for weight, lipids, and CRP — but I² values of 88–95% make the numbers clinically uninterpretable as individual predictions. The critical subgroup finding: LDL-C benefits concentrate entirely in people with existing metabolic disease (SMD −1.85, p=0.03), while metabolically healthy adults show essentially no effect (SMD −0.07, p=0.62). TNF-α and IL-6 are statistically fragile (each loses significance when one trial is removed). Actionable takeaway: the whole-grain/legume swap is well-evidenced for patients managing T2DM, metabolic syndrome, or obesity; healthy adults have no strong metabolic rationale from this study.

Nutrition Research Brief
12/6/2026 · 14:48
2 suscripciones · 27 contenidos

Vistazo a la investigación

Meta-analysis of 21 randomized controlled trials
A meta-analysis published June 12, 2026 in Frontiers in Nutrition pooled 21 randomized controlled trials (n=1,265) and found that low-glycemic-index or low-glycemic-load (LGI/LGL) diets were associated with statistically significant reductions in body weight, BMI, LDL cholesterol, triglycerides, total cholesterol, and C-reactive protein, plus a rise in HDL cholesterol. 1 The effect sizes look large on paper. The authors themselves do not want you to interpret them that way.
Their own conclusion reads: "this meta-analysis underscores the limitations of the existing literature rather than establishing definitive clinical efficacy." 1 Statistical heterogeneity across every primary outcome was extreme — I² values between 88% and 95% — meaning the trials were so different from each other that the pooled average carries limited predictive weight for any individual. Two of the six inflammatory markers (TNF-α and IL-6) lose statistical significance the moment a single trial is removed from each analysis. And the most clinically relevant subgroup finding is a blunt one: the LDL-C benefit is concentrated almost entirely in people with existing metabolic disease. Metabolically healthy adults showed an effect size near zero.
This article explains what the data actually say, where the evidence is reliable, and what the one specific dietary swap that holds up across the trial pool looks like in practice.

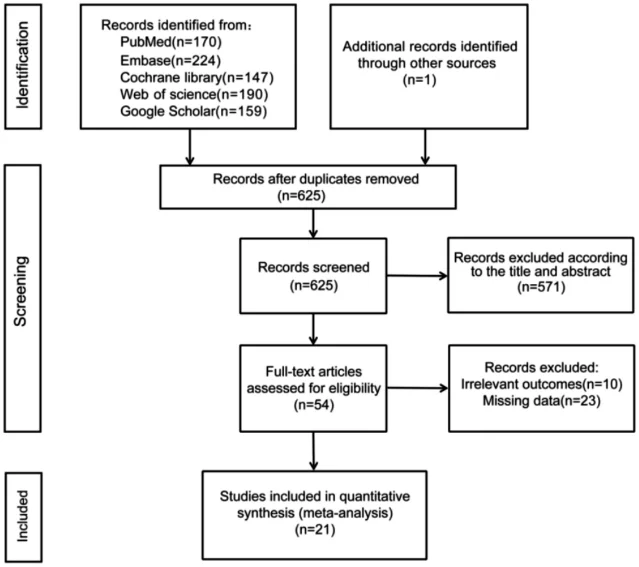
What the researchers did

Wu and colleagues searched five databases (PubMed, Cochrane, EMBASE, Web of Science, and Google Scholar) through November 2025, identifying 890 records and ultimately including 21 RCTs published between 2002 and 2024. The study is registered at PROSPERO (CRD420251247827). 1
Participants across trials came from 15 countries (Greece, Brazil, France, the United Kingdom, Iran, Spain, Australia, Denmark, Italy, the United States, India, Finland, Poland, Canada, and multi-site European trials). The 21 trials enrolled four main population types: 11 trials in overweight or obese adults, 6 in people with type 2 diabetes (T2DM) or metabolic syndrome (MS), 3 in healthy adults, and 1 in a metabolic-syndrome-specific cohort. Intervention duration ranged from 4 weeks to 1 year. Seventeen trials used parallel designs; four used crossover designs. 1
PRISMA flow diagram showing the study selection process for this meta-analysis
PRISMA screening: 890 database records → 625 screened after deduplication → 54 full-text assessed → 21 RCTs included in quantitative synthesis. 1
All effect sizes are reported as standardized mean differences (SMD). Because individual trials measured outcomes in different units and at different scales, SMD is the methodologically appropriate pooled metric — but it cannot be directly translated into "X kg of weight loss" or "Y mg/dL LDL reduction." The conventional interpretation benchmarks are: SMD ≈ 0.2 is small, SMD ≈ 0.5 is moderate, SMD ≥ 0.8 is large. Keep that scale in mind when reading the results below; and keep in mind that extreme heterogeneity limits how much any single SMD value tells you about what would happen to a given patient.

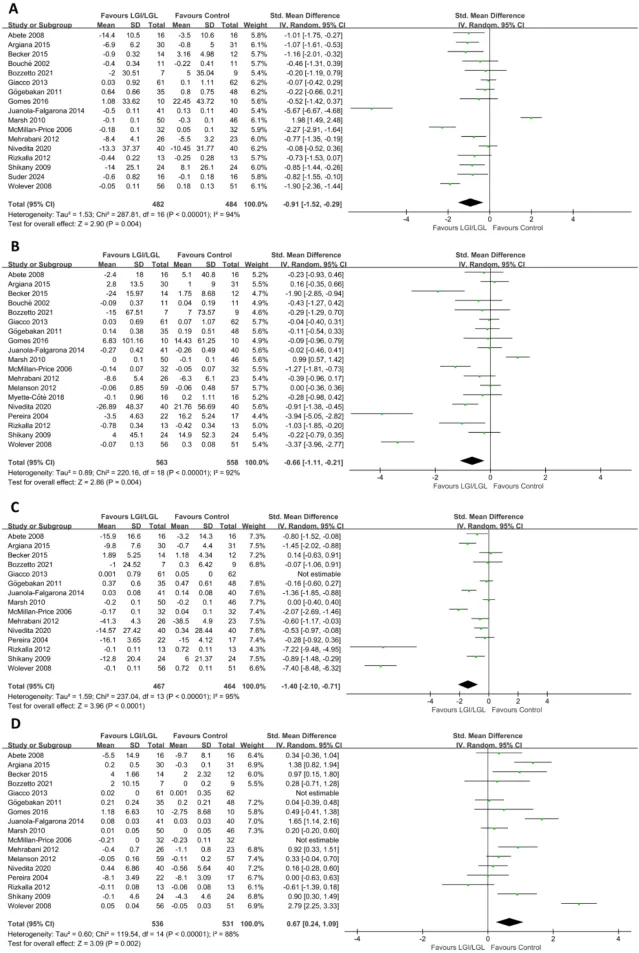
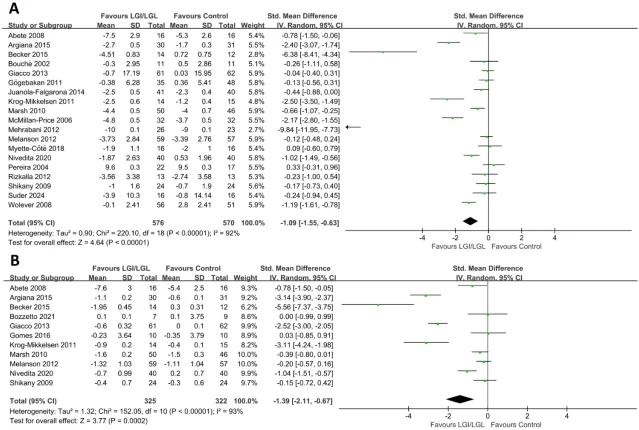
The outcomes that held up

Across the outcomes with the most trials and the most directional consistency, pooled estimates all favored the LGI/LGL group. 1
OutcomeTrials (n)Pooled SMD (95% CI)p-value
Body weight19−1.09 (−1.55, −0.63)<0.00192%
BMI11−1.39 (−2.11, −0.67)<0.00193%
LDL-C15−1.40 (−2.10, −0.71)<0.00195%
Triglycerides19−0.66 (−1.11, −0.21)0.00492%
Total cholesterol17−0.91 (−1.52, −0.29)0.00494%
HDL-C17+0.67 (+0.24, +1.09)0.00488%
CRP14−0.86 (−1.30, −0.41)<0.00191%
Leptin10−1.11 (−1.81, −0.40)0.00290%
Forest plots for total cholesterol (TC), triglycerides (TG), LDL-C, and HDL-C across 15–19 trials each, random-effects models
Lipid forest plots (panels A–D): TC, TG, LDL-C, and HDL-C each show consistent directional effects but wide inter-trial scatter, consistent with I² values of 88–95%. 1
Every outcome in this table is nominally statistically significant, and every SMD falls in the "large" range by Cohen's convention. The I² values, however, are a problem. I² describes the proportion of variability across trials that reflects real differences between studies rather than sampling error. Values above 75% are generally considered "high"; values above 90% are exceptional. Every single outcome here exceeds 88%. 1 The authors acknowledge this directly: "the profound statistical heterogeneity (I² > 90%) observed herein reflects the inherent, unavoidable clinical diversity characteristic of free-living dietary interventions." 1
In practical terms: the pooled number is a mathematical average of very different results pointing in similar directions. It tells you the direction is likely real; it does not tell you how large the effect will be for any specific person.
Forest plots for body weight (panel A, 19 trials, SMD −1.09) and BMI (panel B, 11 trials, SMD −1.39) under random-effects models
Body weight and BMI forest plots: individual trial estimates fan widely, consistent with I² values of 92% and 93% respectively. 1
CRP deserves a separate note. It was the most consistent inflammatory signal, with 14 trials contributing to an SMD of −0.86 and I² of 91%. The authors caution, however, that CRP is a non-specific acute-phase reactant influenced by stress, subclinical infection, and autoimmune activity — all of which are unmeasured confounders in free-living dietary trials. The reduction may partly reflect general improvements in lifestyle rather than a direct effect of glycemic index per se. 1

The outcomes that did not hold up

Two inflammatory markers showed statistically significant pooled estimates that dissolved under sensitivity analysis. The authors are explicit: "because the statistical significance of TNF-α and IL-6 was heavily dependent on individual trials, these specific inflammatory outcomes cannot be considered robust and must be interpreted with extreme caution." 1
TNF-α (5 trials, n=278): pooled SMD = −0.41 (95% CI −0.64, −0.17), p<0.001 using a fixed-effects model. When Giacco et al. (2013) — the largest contributing trial — is excluded, the estimate shifts to SMD = −0.29 (95% CI −0.60, 0.03), p = 0.08, losing significance entirely. 1
IL-6 (7 trials, n=420): pooled SMD = −0.55 (95% CI −1.04, −0.06), p = 0.03. When Mehrabani et al. (2012) is excluded, the estimate shifts to SMD = −0.54 (95% CI −1.11, 0.03), p = 0.06, again crossing the significance threshold. 1
Adiponectin (5 trials): the pooled estimate was non-significant overall (SMD = +0.16, p = 0.28), and the direction of the effect reversed when one trial was excluded — a finding the authors describe as the result of a single heterogeneity driver. 1
Forest plots for CRP (panel A), TNF-α (panel B), IL-6 (panel C), adiponectin (panel D), and leptin (panel E) under random- and fixed-effects models
Inflammatory marker forest plots: TNF-α (panel B) uses a fixed-effects model (I²=0%), reflecting the small trial set; IL-6 and CRP both show wide per-trial spread consistent with high heterogeneity; adiponectin (panel D) did not reach significance. 1
These three outcomes should not be cited as evidence that LGI/LGL diets reduce systemic inflammation. The CRP signal is the only one with enough trials and directional consistency to warrant cautious mention — and even that carries caveats.

The finding that matters most: who benefits for LDL-C

The most actionable result in this paper is a subgroup analysis. Among the 15 trials measuring LDL-C, the authors stratified participants by health status and found sharply different effects: 1
Health status subgroupTrialsSMD (95% CI)p-value
Metabolic conditions (T2DM, MS)5−1.85 (−3.51, −0.19)0.03
Overweight/obese8−1.22 (−1.91, −0.52)<0.001
Healthy individuals2−0.07 (−0.37, 0.22)0.62
The between-group difference is statistically significant (p = 0.002). 1 Among metabolically healthy adults, the LDL-C effect is essentially zero — SMD of −0.07 with a confidence interval that spans both slightly negative and slightly positive territory.
The authors' interpretation: baseline metabolic status is likely the primary driver of LDL-C heterogeneity. Combining participants across different metabolic phenotypes, from healthy volunteers to those with severe insulin resistance, inherently drives effect-size variance. 1
The implication for clinical guidance is clear: the lipid-lowering rationale for LGI/LGL diets applies most directly to people already managing T2DM, metabolic syndrome, or overweight/obesity. For healthy adults, this study does not provide evidence of a meaningful LDL benefit.
Publication bias was formally assessed for BMI (the outcome with ≥10 contributing trials). The funnel plot was visually symmetrical, with Begg's test p = 0.559 and Egger's test p = 0.095, providing no evidence of selective reporting for that outcome. 1

Limitations

Risk of bias across all 21 trials. Every single included trial received an "unclear" rating for allocation concealment — meaning none of them adequately reported whether the randomization sequence was hidden from people enrolling participants. Twenty of the 21 trials were rated high risk for detection bias (inadequate blinding of outcome assessors). Nine were rated high risk for performance bias (blinding of participants and personnel). Not one trial had a low risk-of-bias rating across all domains. 1 These are not minor methodological footnotes — systematic detection bias inflates observed effect sizes.
Intervention heterogeneity. Across the 21 trials, the GI of the "low-GI" arm ranged from approximately 19 to 79; the GI of the control arm ranged from approximately 60 to 127. Some trials combined LGI with caloric restriction, high protein, or an exercise component. Duration ranged from 4 weeks to 1 year. The authors were unable to perform meta-regression to quantify how much of the variance each factor explains, because individual trials reported covariates inconsistently. 1
No absolute effect values. All results are SMDs. There is no way to read this paper and conclude "switching to low-GI foods will lower my LDL by X mg/dL." Recovering absolute estimates would require returning to the raw data of all 21 individual trials.
Missing data. Of the 33 studies excluded at full-text review, 23 were excluded for missing data even after the authors contacted corresponding authors. If those studies' outcomes differ systematically from the included set, the pooled estimates may be biased. 1
Long-term effects are unknown. The longest included trial ran one year. Whether LGI/LGL diets sustain metabolic benefits beyond that window, or whether effects attenuate, remains an open question.
Funding and conflicts of interest. The study was funded by the Chinese Academy of Traditional Chinese Medicine (Innovation Program ZN2025A06) and the Beijing Xinhuo Inheritance "3+3" Project (2023-SZ-A51) — both government sources. The authors declared no commercial or financial conflicts of interest and explicitly noted they did not use generative AI in the study's conduct or reporting. The article is open access under CC BY 4.0. 1

What to do with this today

The paper's bottom line, stripped of its extreme statistical heterogeneity caveats, is that RCT evidence consistently points in one direction: choosing lower-GI carbohydrates over refined, high-GI carbohydrates is associated with improvements in weight and lipid markers — and that direction holds across 21 trials in 15 countries. The caveat is that the magnitude of the benefit varies enormously and depends heavily on who you are metabolically.
If you have T2DM, metabolic syndrome, or are significantly overweight: the LGI/LGL swap is well-supported. The LDL-C subgroup data (SMD −1.85 in metabolic-condition participants, p = 0.03) and the body weight and TG reductions across 19 trials all point the same direction. The practical swaps are consistent with established guidance from prior meta-analyses:
  • Replace white rice and white bread with intact whole grains (barley, bulgur, oats, whole-grain rye bread). GI drops from ~70–85 to ~40–55.
  • Replace sugary breakfast cereals with rolled oats or steel-cut oats. GI drops from ~80 to ~55.
  • Add lentils, chickpeas, or kidney beans to one or two meals per week. Most legumes have GI values below 40.
  • Choose whole fruit over fruit juice; the intact fiber matrix slows glucose absorption.
These are foods, not a therapeutic protocol. If you are managing T2DM or dyslipidemia with medication, these changes complement — they do not replace — medication and clinical supervision.
If you are metabolically healthy: this study does not give you a strong metabolic rationale for a LGI/LGL overhaul. The LDL-C effect was SMD −0.07 (p = 0.62) in the healthy subgroup, and only 2 trials contributed data there. That is not evidence of harm from lower-GI eating — it is simply an absence of evidence for the specific metabolic benefits tested here. The same food swaps above remain consistent with general dietary quality guidance and carry no downside.
What this study does not support: claiming that LGI/LGL diets reduce TNF-α or IL-6 (the evidence is statistically fragile), claiming LGI/LGL diets are superior to other healthy dietary patterns like Mediterranean or DASH (no head-to-head data), or projecting any specific absolute change in weight or LDL from these SMD values.
Cover image: AI-generated illustration.

Añade más opiniones o contexto en torno a este contenido.

  • Inicia sesión para comentar.